Key figures
| EUR million | 2024 | 2023 | 2022 | 2021 | 2020 | 2019 |
| Revenue | 2,948 | 3,384 | 3,570 | 2,674 | 2,427 | 2,659 |
| Revenue, O&G divestment adjusted | 2,904 | 2,889 | ||||
| Operative EBITDA | 585.4 | 666.7 | 571.6 | 425.5 | 435.1 | 410.0 |
| Operative EBITDA, O&G divestment adjusted | 582.1 | 595.9 | ||||
| Operative EBITDA, % | 19.9 | 19.7 | 16.0 | 15.9 | 17.9 | 15.4 |
| Operative EBITDA, %, O&G divestment adjusted | 20.0 | 20.6 | ||||
| EBITDA | 550.7 | 540.0 | 558.8 | 373.2 | 413.2 | 382.3 |
| EBITDA, % | 18.7 | 16.0 | 15.7 | 14.0 | 17.0 | 14.4 |
| Operative EBIT | 398.7 | 463.0 | 361.6 | 225.4 | 237.7 | 224.0 |
| Operative EBIT, O&G divestment adjusted | 395.5 | 415.5 | ||||
| Operative EBIT, % | 13.5 | 13.7 | 10.1 | 8.4 | 9.8 | 8.4 |
| Operative EBIT, %, O&G divestment adjusted | 13.6 | 14.4 | ||||
| EBIT | 363.2 | 336.4 | 347.6 | 170.1 | 215.9 | 194.4 |
| EBIT, % | 12.3 | 9.9 | 9.7 | 6.4 | 8.9 | 7.3 |
| EPS, EUR | 1.61 | 1.28 | 1.50 | 0.70 | 0.86 | 0.72 |
| Dividend/Share | 0.74** | 0.68 | 0.62 | 0.58 | 0.58 | 0.56 |
| ROCE, %* | 18.9 | 15.6 | 16.2 | 8.5 | 11.0 | 9.7 |
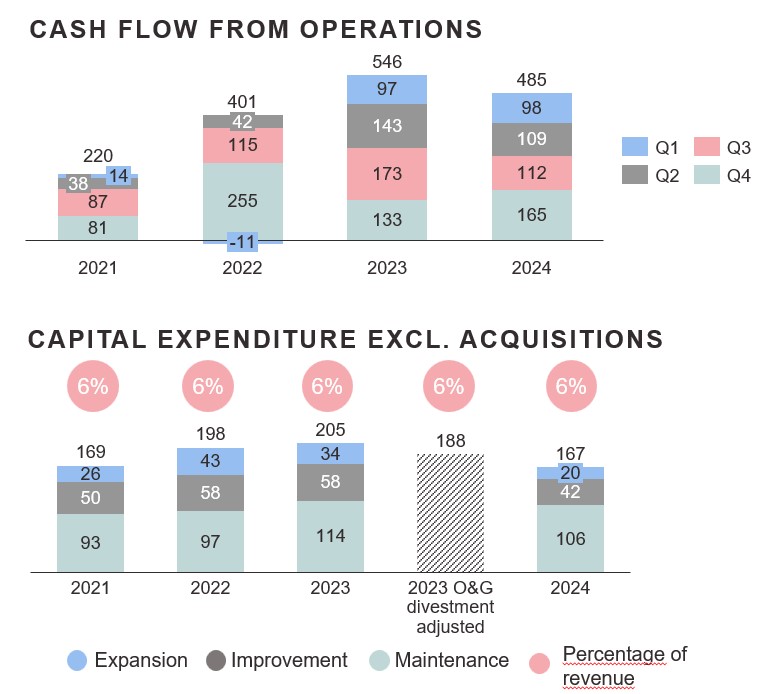
| Cash flow from the operating activities | 484.6 | 546.0 | 401.0 | 220.2 | 374.7 | 386.2 |
| CAPEX, excl M&A | 167.3 | 204.9 | 197.9 | 168.8 | 195.6 | 201.1 |
| Gearing, % | 16 | 32 | 46 | 63 | 63 | 66 |
| Personnel at year-end | 4,698 | 4.915 | 4,902 | 4,926 | 4,921 | 5,062 |
*12 month rolling average
**Proposal to the Annual General Meeting 2025. Dividend payments in two installments of EUR 0.37 in April and in November.
Since some figures are rounded, the sum of individual figures may deviate from the presented sums.
Kemira divested its Oil & Gas (O&G)-related portfolio on February 2, 2024. All comparisons in the Q4 2024 report are made to the comparison period which includes the Oil & Gas-related portfolio.

